後編の目標
現代のデータ分析では、特にテキストデータや高次元データの扱いが難しく、複雑なデータ構造の理解と分析が求められます。これらのデータから隠れたパターンや構造を見つけることは、ビジネスのインサイトや新たな発見を生み出すために不可欠です。本記事では、これらの目的を達成するために有効なテーマモデリングと次元削減の技術について学びます。
具体的には、以下の3つのポイントを目指します。
- LDA(Latent Dirichlet Allocation)を用いたテーマモデリングの習得
文書データから潜在的なトピックを抽出し、データの構造を解明する方法を学びます。LDAの理論的背景を理解し、Pythonで実装することで、テキストデータに含まれる潜在構造を視覚化・解釈するスキルを身につけます。 - オートエンコーダを用いた次元削減技術の理解と実践
複雑な高次元データを効率的に圧縮し、重要な特徴を抽出する方法を習得します。オートエンコーダの構造や学習プロセスを学び、実際にPythonで実装することで、次元削減を活用してデータの重要な特徴を捉えるスキルを磨きます。 - 実践的なデータモデリングへの応用
LDAやオートエンコーダを用いて複雑なデータを分析する技術を、実践的な場で応用する方法を学びます。具体的なデータセットでの使用例を通じて、ビジネスシーンにおいても即戦力となるスキルの習得を目指します。
LDA(Latent Dirichlet Allocation:潜在ディリクレ配分法)
LDA(潜在ディリクレ配分法)は、テキストデータから潜在的なトピックを抽出するための生成的な確率モデルです。LDAは「各文書は複数のトピックから構成される」「各トピックは特定の単語分布を持つ」という前提に基づいており、以下のようなタスクに役立ちます。
- 文書分類:大量のテキストデータをトピックごとに分類
- 情報検索:ユーザーのクエリに基づいて関連するトピックを持つ文書を検索
- 推薦システム:ユーザーの興味をトピックとしてモデル化し、関連コンテンツを推奨
LDAは、このようなタスクを確率的生成プロセスを用いて、文書に内在するトピック構造を学習し可視化する手法です。
確率的生成モデルとしてのLDA
LDA(潜在ディリクレ配分法)の中心的な考え方は、各文書が「トピック分布」に従い、各トピックが「単語分布」に従って生成されると仮定することです。これは、確率的生成モデルであるベイズ統計とマルコフ連鎖モンテカルロ法に基づいています。LDAが仮定する生成プロセスを以下に示します。
ベイズ統計:確率的生成モデルにおけるパラメータの事後分布を求める枠組みを提供します。
MCMC法:複雑な事後分布からのサンプリングによってベイズ推論を実行するための手段です。
LDAの生成プロセス
- ディリクレ分布からトピック分布 $θ_d$ をサンプリング
- 各文書 $d$ はディリクレ分布 $θ_d∼Dir(α)$から得られるトピック分布を持ちます。この分布は、文書内でトピックがどの程度の割合で出現するかを表します。
- $α$ は、ディリクレ分布のハイパーパラメータであり、トピックの分散を調整します。例えば、$α$ が小さいほど、文書内の少数のトピックに集中するようになります。
- 各単語ごとに以下を繰り返す。
- トピック $z_n$ をサンプリング:
文書のトピック分布 $θ_d$ からトピック $z_n$ をサンプリングします。このステップで、各単語がどのトピックから生成されるかが決まります。 - 単語 $w_n$ をサンプリング:
トピック $z_n$ に対応する単語分布 $β_{z_n}$ から単語 $w_n$ をサンプリングします。ここで、各トピックは特定の単語分布 ${(β_k)}$ を持ち、これにより文書内の単語が生成されます。
- トピック $z_n$ をサンプリング:
ディリクレ分布とトピック分布の違い
| 項目 | ディリクレ分布 | トピック分布 |
|---|---|---|
| 定義 | 確率ベクトルの生成元となる分布 | 各文書内のトピックの割合を示す確率ベクトル |
| 役割 | トピック分布の生成元として使われる | 文書内での各トピックの出現割合を示す |
| ハイパーパラメータ | ${ \alpha }$ によって分散が制御される | なし(ディリクレ分布からサンプリングされる結果) |
| 数学的な意味 | 多項分布の事前分布 | 各文書に固有の確率ベクトル |
ディリクレ分布は確率ベクトルを生成するための分布であり、トピック分布はその生成結果として得られる各文書ごとの固有の分布です。
数式によるアルゴリズムの解説
文書生成の確率:
$$P(w|\theta, \beta) = \prod_{n=1}^{N} \sum_{k=1}^{K} P(z_n = k|\theta) P(w_n | z_n = k, \beta)$$
$w$:文書内の単語列、$\theta$:文書のトピック分布、$\beta$:トピックごとの単語分布、
$N$:文書内の単語数、$K$:トピック数
この数式は、LDAがトピックと単語の出現確率の両方を考慮し、文書が生成される過程を説明するものです。
ディリクレ分布と多項分布の関係
LDA(潜在ディリクレ配分法)では、ディリクレ分布がトピック分布や単語分布の事前分布として機能します。これは、トピックや単語がどの程度分散しているか、不確実性をモデル化するためのものです。
ディリクレ分布の役割
- トピック分布の不確実性を表現:文書ごとに異なるトピック分布を仮定し、異なるトピック間での文書の多様性を確保します。
- 単語分布の不確実性をモデル化:各トピックに対して単語の出現分布をモデル化し、トピックごとに異なる特徴的な単語を持たせることができます。
LDAのパラメータ推定方法
LDA(潜在ディリクレ配分法)の学習は、トピック分布 $θ$ と単語分布 $β$ のパラメータを推定することで行います。これには、以下の推定方法が用いられます。
- ギブスサンプリング:
- マルコフ連鎖モンテカルロ法(MCMC)の一種で、各単語のトピック割り当てを反復的に更新する方法です。ギブスサンプリングは収束が早く、比較的小規模のデータセットに対して有効です。
- ギブスサンプリングでは、ある単語が各トピックに属する確率を計算し、その確率に基づいて次のトピック割り当てを決定します。
- 変分ベイズ推定:
- 変分推論は、近似推論手法の一種で、事後分布を効率的に推定する方法です。変分ベイズでは、ギブスサンプリングのように個別の割り当てを計算するのではなく、分布全体を更新します。大規模データセットに対しても高速で適用可能です。
LDA(潜在ディリクレ配分法)の全体の流れ
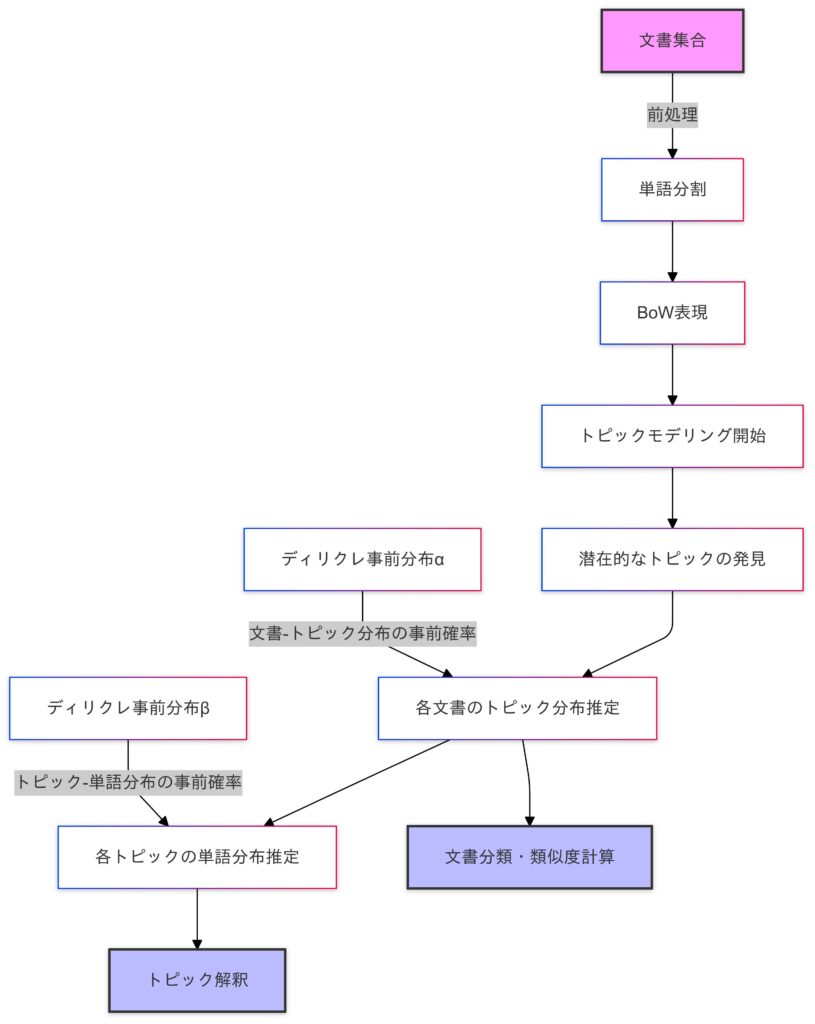
BoWとは?:文書を単語の出現頻度で数値化する手法。
LDAの実装
データセットの概要と特徴
今回はKaggleの「Newsgroup20」データセットを使用します。今回はNewsgroup20のテキストを使ってLDAの実装を行うため、以下のファイルをお使い頂くとスムーズに実装することが可能です。
KaggleのNewsgroup20データセットは、20個の異なるニュースグループから収集された約20,000件のニュース記事の集合です。このデータセットは、LDAなどのトピックモデリング手法を実装し、評価するのに適したデータセットとして広く利用されています。
LDAのアルゴリズムの課題と目的
LDAを適用することで、ニュース記事のトピック抽出、ニュースグループのトピック分析、ニュース記事間の類似度計算、新しいニュース記事のトピック予測などを行うことができます。
例えば、Newsgroup20データセットに対してLDAを適用し、3つのトピックを抽出するとします。すると、各ニュース記事は、これらの3つのトピックのいずれかに関連付けられます。
- トピック1: コンピュータ、ソフトウェア、ハードウェア
- トピック2: 宗教、神学、哲学
- トピック3: 政治、経済、社会
あるニュース記事が、トピック1に0.8、トピック2に0.1、トピック3に0.1という確率で関連付けられたとします。これは、そのニュース記事が、コンピュータ関連のトピックに強く関連していることを示しています。
また、新たにニュース記事が与えられた場合、LDAモデルを使ってその記事がどのトピックに関連しているかを予測することができます。
使用ライブラリの紹介
- gensim:トピックモデルの実装が豊富なライブラリ
- nltk:テキスト前処理に便利なツールを提供
コード例と解説
path確認
フォルダの中のファイルをcsvファイルに入れるために、フォルダ内のパスの確認を行います。
import os

# 現在の作業ディレクトリを表示
print("Current working directory:", os.getcwd())

# newsgroup20フォルダ内のファイルを確認
newsgroup_path = '/Users/yoshihisashinzaki/Desktop/Python/env/newsgroup20'
print("\nChecking files in:", newsgroup_path)

if os.path.exists(newsgroup_path):
    print("Directory exists!")
    for root, dirs, files in os.walk(newsgroup_path):
        print("\nDirectory:", root)
        print("Files:", [f for f in files if f.endswith('.txt')])
else:
    print("Directory not found!")
テキストファイルからdocument_idの抽出
指定されたディレクトリ内のテキストファイルから document_id を抽出し、結果をCSVファイルに保存します。
import os
import pandas as pd
import re

# 絶対パスを使用
newsgroup_path = '/Users/yoshihisashinzaki/Desktop/Python/env/newsgroup20'
data_list = []

def extract_document_ids(content):
    """テキストから document_id を抽出する関数"""
    # From行からdocument_idを抽出する正規表現パターン
    pattern = r'From:.*?(\d{5})'
    ids = re.findall(pattern, content)
    return ids

for file in os.listdir(newsgroup_path):
    if file.endswith('.txt'):
        # ニュースグループ名を取得(.txtを除去)
        newsgroup = os.path.splitext(file)[0]
        file_path = os.path.join(newsgroup_path, file)

        print(f"Processing: {file}")  # デバッグ用

        try:
            with open(file_path, 'r', encoding='latin-1', errors='ignore') as f:
                content = f.read()
                # document_idを抽出
                document_ids = extract_document_ids(content)
                print(f"Found {len(document_ids)} IDs in {file}")  # デバッグ用

                # 各IDをデータリストに追加
                for doc_id in document_ids:
                    data_list.append({
                        'newsgroup': newsgroup,
                        'document_id': doc_id
                    })

        except Exception as e:
            print(f"Error reading {file}: {e}")

# 結果を表示
print(f"\nTotal entries found: {len(data_list)}")

# DataFrameを作成してCSVに保存
df = pd.DataFrame(data_list)
print(f"DataFrame shape: {df.shape}")
df.to_csv('newsgroup20.csv', index=False)

# 最初の数行を表示して確認
print("\nFirst few rows of the DataFrame:")
print(df.head())
このコードによってnewsgroup20.csvファイルにnewsgroup20フォルダ内のテキストファイルの「document_id」情報が保存されました。
データの読み込みと確認
from gensim import corpora
from nltk.corpus import stopwords
from gensim.models import CoherenceModel
import matplotlib.pyplot as plt
import japanize_matplotlib
import pandas as pd
import numpy as np
import gensim
import nltk
import os
nltk.download('stopwords')
# 現在のディレクトリのパスを取得
current_dir = os.getcwd()
print(f"Current directory: {current_dir}")
# データの読み込み
data = pd.read_csv('newsgroup20.csv')data.tail()newsgroup document_id
1237 talk.politics.misc 14600
1238 talk.politics.misc 4447
1239 talk.politics.misc 4447
1240 talk.politics.misc 14600
1241 talk.politics.misc 14600テキストファイルの読み込みと確認
def load_document_text(newsgroup, doc_id):
    """newsgroupとdocument_idから対応するテキストを読み込む"""
    # 絶対パスを使用
    file_path = os.path.join(current_dir, f"{newsgroup}.txt")
    print(f"Trying to read: {file_path}")  # デバッグ用

    try:
        with open(file_path, 'r', encoding='latin-1') as f:
            content = f.read()
            paragraphs = content.split('\n\n')
            for para in paragraphs:
                if str(doc_id) in para:
                    return para
    except Exception as e:
        print(f"Error reading {file_path}: {e}")
    return ""

# ファイルの存在確認
print("\nChecking available files:")
for file in os.listdir(current_dir):
    if file.endswith('.txt'):
        print(f"Found: {file}")
Checking available files:
Found: sci.crypt.txt
Found: comp.sys.mac.hardware.txt
Found: misc.forsale.txt
Found: soc.religion.christian.txt
Found: rec.sport.baseball.txt
Found: rec.sport.hockey.txt
Found: comp.sys.ibm.pc.hardware.txt
Found: talk.politics.guns.txt
Found: rec.autos.txt
Found: alt.atheism.txt
Found: comp.os.ms-windows.misc.txt
Found: sci.electronics.txt
Found: comp.windows.x.txt
Found: talk.religion.misc.txt
Found: talk.politics.mideast.txt
Found: sci.med.txt
Found: rec.motorcycles.txt
Found: comp.graphics.txt
Found: sci.space.txt
Found: talk.politics.misc.txt文書の読み込み
# 各文書のテキストを取得
texts = []
print("\nLoading documents...")
for _, row in data.iterrows():
    text = load_document_text(row['newsgroup'], row['document_id'])
    if text.strip():  # 空のテキストをスキップ
        texts.append(text)
    if len(texts) % 100 == 0:  # 進行状況を表示
        print(f"Processed {len(texts)} documents")

# テキストの内容を確認
print("\nFirst document sample:")
print(texts[0][:200] if texts else "No documents loaded")

# テキストの総数を表示
print(f"Loaded {len(texts)} documents")
Loading documents...
Trying to read: /Users/yoshihisashinzaki/Desktop/Python/env/newsgroup20/sci.crypt.txt
Trying to read: /Users/yoshihisashinzaki/Desktop/Python/env/newsgroup20/sci.crypt.txt
Trying to read: /Users/yoshihisashinzaki/Desktop/Python/env/newsgroup20/sci.crypt.txt
...
>>If you have access to FTP, try FTPing to rsa.com, login as anonymous.
>>There are several documents there, including a "frequently asked questions
>>about today's cryptography" document. It has FAQ
Loaded 1242 documents1242のdocumentsの読み込みが終わりました。
前処理(テキストデータを単語に分割・ストップワードを除去)
1242のdocumentを単語にし、重要性が低いと見なされる単語である(”the”, “is”, “in”, “and”, “to”, “of”)を除去。ストップワードの除去はノイズの削減、効率の向上、意味の強調のために必要です。
# 前処理
stop_words = set(stopwords.words('english'))
processed_texts = []

for text in texts:
    # テキストを単語に分割し、前処理
    tokens = gensim.utils.simple_preprocess(text, deacc=True)
    # ストップワードを除去
    tokens = [word for word in tokens if word not in stop_words]
    if tokens:  # 空のトークンリストをスキップ
        processed_texts.append(tokens)

print(f"\nProcessed {len(processed_texts)} documents")
print("\nFirst processed document sample:")
print(processed_texts[0][:20] if processed_texts else "No processed documents")
Processed 1242 documents
First processed document sample:
['access', 'ftp', 'try', 'ftping', 'rsa', 'com', 'login', 'anonymous', 'several', 'documents', 'including', 'frequently', 'asked', 'questions', 'today', 'cryptography', 'document', 'faq', 'name', 'believe']辞書とコーパスの作成
前処理されたテキストデータから辞書とコーパスを作成し、トピックモデリングアルゴリズムに入力できる形式にし、LDAモデルを訓練してトピックを抽出します。
# 辞書とコーパスの作成
if processed_texts:
    dictionary = corpora.Dictionary(processed_texts)
    print(f"\nDictionary size: {len(dictionary)}")

    corpus = [dictionary.doc2bow(text) for text in processed_texts]
    print(f"Corpus size: {len(corpus)}")

    # 最初のドキュメントの単語-頻度ペアを表示
    print("\nFirst document word-frequency pairs:")
    if corpus:
        print(corpus[0])

    # LDAモデルの訓練
    if len(dictionary) > 0 and len(corpus) > 0:
        lda_model = gensim.models.LdaModel(
            corpus=corpus,
            id2word=dictionary,
            num_topics=5,
            random_state=42,
            passes=10,
            alpha='auto',
            per_word_topics=True
        )

        # 結果の表示
        print("\nTop words in each topic:")
        for idx, topic in lda_model.print_topics(-1):
            print(f'Topic {idx}: {topic}')
    else:
        print("Dictionary or corpus is empty")
else:
    print("No documents to process")
辞書(Dictionary)とは?
- 各単語に一意のIDを割り当てる。
- テキストデータを数値データに変換するための基盤を提供する。
print(dictionary.token2id){'access': 0, 'anonymous': 1, 'asked': 2, 'authorities': 3, 'behind': 4, 'believe': 5, 'certifying': 6, 'com': 7,.....コーパス(Corpus)とは?
- テキストデータを数値データに変換し、機械学習モデルに入力できる形式にする。(BoW形式)
- トピックモデリングやその他のNLPタスクに使用される。
辞書とコーパスを作成し、テキストデータを数値データに変換することで、LDAなどのトピックモデリングアルゴリズムに入力できる形式にします。
ハイパーパラメータチューニングを行うためのベイズの最適化
from hyperopt import fmin, tpe, hp, Trials, STATUS_OK

# 辞書とコーパスの作成
if processed_texts:
    dictionary = corpora.Dictionary(processed_texts)
    print(f"\nDictionary size: {len(dictionary)}")

    corpus = [dictionary.doc2bow(text) for text in processed_texts]
    print(f"Corpus size: {len(corpus)}")

    # 最初のドキュメントの単語-頻度ペアを表示
    print("\nFirst document word-frequency pairs:")
    if corpus:
        print(corpus[0])

    # Hyperopt用にハイパーパラメータの探索空間を定義
    space = {
        'num_topics': hp.quniform('num_topics', 5, 20, 1),
        'passes': hp.quniform('passes', 10, 30, 1),
        'alpha': hp.choice('alpha', ['symmetric', 'asymmetric', 'auto']),
        'eta': hp.choice('eta', ['symmetric', 'auto'])
    }

    # 目的関数の定義
    def objective(params):
        num_topics = int(params['num_topics'])
        passes = int(params['passes'])
        alpha = params['alpha']
        eta = params['eta']

        # LDAモデルの訓練
        lda_model = gensim.models.LdaModel(
            corpus=corpus,
            id2word=dictionary,
            num_topics=num_topics,
            random_state=42,
            passes=passes,
            alpha=alpha,
            eta=eta,
            per_word_topics=True
        )

        # コヒーレンススコアの計算
        coherence_model_lda = CoherenceModel(
            model=lda_model,
            texts=processed_texts,
            dictionary=dictionary,
            coherence='c_v'
        )
        coherence_lda = coherence_model_lda.get_coherence()

        print(f'Num Topics: {num_topics}, Passes: {passes}, Alpha: {alpha}, Eta: {eta}, Coherence: {coherence_lda:.4f}')

        return {'loss': -coherence_lda, 'status': STATUS_OK}

    # Trialsオブジェクトの作成
    trials = Trials()

    # ベイズ最適化の実行
    best = fmin(
        fn=objective,
        space=space,
        algo=tpe.suggest,
        max_evals=50,  # 訓練回数を設定
        trials=trials,
        rstate=np.random.default_rng(42)
    )

    # bestはハイパーパラメータのインデックスを返すため、実際の値を取得
    best_params = {
        'num_topics': int(best['num_topics']),
        'passes': int(best['passes']),
        'alpha': ['symmetric', 'asymmetric', 'auto'][best['alpha']],
        'eta': ['symmetric', 'auto'][best['eta']]
    }

    print(f"\nBest Coherence: {-min([trial['result']['loss'] for trial in trials.trials]):.4f}")
    print(f"Best Parameters: {best_params}")

    # 最適なハイパーパラメータでLDAモデルを再訓練
    lda_model = gensim.models.LdaModel(
        corpus=corpus,
        id2word=dictionary,
        num_topics=best_params['num_topics'],
        random_state=42,
        passes=best_params['passes'],
        alpha=best_params['alpha'],
        eta=best_params['eta'],
        per_word_topics=True
    )

    # 結果の表示
    print("\nTop words in each topic:")
    for idx, topic in lda_model.print_topics(-1):
        print(f'Topic {idx}: {topic}')
トピックの分布を可視化
# 各文書のトピック分布を取得
doc_topics = []
for doc_bow in corpus:
    doc_topics.append(lda_model.get_document_topics(doc_bow))

# トピック分布をデータフレームに変換
topic_dist = []
for doc in doc_topics:
    topic_dist.append([prob for _, prob in doc])

df_topic_dist = pd.DataFrame(topic_dist)
df_topic_dist.columns = [f'Topic {i}' for i in range(1, len(df_topic_dist.columns) + 1)]

# トピック分布を可視化
plt.figure(figsize=(10, 6))
for i in range(len(df_topic_dist.columns)):
    plt.plot(df_topic_dist.index, df_topic_dist[f'Topic {i+1}'], label=f'Topic {i+1}')

plt.xlabel('Document Index')
plt.ylabel('Topic Probability')
plt.title('Document Topic Distribution')
plt.legend()
plt.show()
ベイズ最適化を使用してLDAモデルのハイパーパラメータを最適化し、最適なパラメータセットを用いてトピックモデリングを行うことができます。
クラスタリングで分布を確認
from sklearn.cluster import KMeans
from sklearn.decomposition import PCA

# NaN値を0に置き換え
df_topic_dist = df_topic_dist.fillna(0)

# K-meansクラスタリングを実行
num_clusters = 5
kmeans = KMeans(n_clusters=num_clusters, random_state=42)
kmeans.fit(df_topic_dist)
clusters = kmeans.labels_

# クラスタリング結果をデータフレームに追加
df_topic_dist['Cluster'] = clusters

# PCAを使用して次元削減
pca = PCA(n_components=2, random_state=42)
pca_result = pca.fit_transform(df_topic_dist.drop('Cluster', axis=1))

df_topic_dist['PCA1'] = pca_result[:, 0]
df_topic_dist['PCA2'] = pca_result[:, 1]

# クラスタリング結果を可視化
plt.figure(figsize=(10, 6))
scatter = plt.scatter(df_topic_dist['PCA1'], df_topic_dist['PCA2'], c=df_topic_dist['Cluster'], cmap='viridis')
plt.xlabel('PCA1')
plt.ylabel('PCA2')
plt.title('Document Clustering based on Topic Distribution')
plt.legend(*scatter.legend_elements(), title="Clusters")
plt.show()
5つのクラスタにより類似度がわかります。またPCAにより2次元に次元削減されデータの分散が最大となる方向(主成分)を見つけ出し、その方向に沿ってデータを投影します。これにより、データの重要な特徴を抽出できます。
各主成分の説明分散割合を表示
explained_variance_ratio = pca.explained_variance_ratio_
print(f"Explained variance ratio of PCA1: {explained_variance_ratio[0]:.4f}")
print(f"Explained variance ratio of PCA2: {explained_variance_ratio[1]:.4f}")
Explained variance ratio of PCA1: 0.7430
Explained variance ratio of PCA2: 0.2476主成分に対応するクラスタラベルを表示
PCA1:
sorted_pca1 = df_topic_dist.sort_values(by='PCA1', ascending=False)

print("\nTop 5 PCA1 values and corresponding clusters (sorted by PCA1):")
for i in range(5):
    print(f"PCA1: {sorted_pca1['PCA1'].iloc[i]:.4f}, Cluster: {sorted_pca1['Cluster'].iloc[i]}")
Top 5 PCA1 values and corresponding clusters (sorted by PCA1):
PCA1: 0.6551, Cluster: 0
PCA1: 0.6551, Cluster: 0
PCA1: 0.6551, Cluster: 0
PCA1: 0.6551, Cluster: 0
PCA1: 0.6548, Cluster: 0PCA2:
sorted_pca2 = df_topic_dist.sort_values(by='PCA2', ascending=False)

print("\nTop 5 PCA2 values and corresponding clusters (sorted by PCA2):")
for i in range(5):
    print(f"PCA2: {sorted_pca2['PCA2'].iloc[i]:.4f}, Cluster: {sorted_pca2['Cluster'].iloc[i]}")
Top 5 PCA2 values and corresponding clusters (sorted by PCA2):
PCA2: 1.4058, Cluster: 4
PCA2: 1.4058, Cluster: 4
PCA2: 1.4058, Cluster: 4
PCA2: 1.4058, Cluster: 4
PCA2: 1.4058, Cluster: 4PCA1, PCA2のそれぞれの上位の5つの分布に対応するクラスタ名を表示
LDAモデルの様々な分析方法
トピックの妥当性評価(トピックコヒーレンスの計算)
トピックコヒーレンスを計算することで、各トピックの一貫性や意味的な妥当性を評価できます。高いコヒーレンススコアは、トピックが関連性の高い単語で構成されていることを示します。
from gensim.models import CoherenceModel

# コヒーレンスモデルの作成
coherence_model_lda = CoherenceModel(model=lda_model, texts=processed_texts, dictionary=dictionary, coherence='c_v')
coherence_lda = coherence_model_lda.get_coherence()
print(f'トピックコヒーレンス: {coherence_lda:.4f}')

# コヒーレンススコアの評価
if coherence_lda >= 0.5:
    print("トピックの妥当性は高いと言えます。")
else:
    print("トピックの妥当性は低い可能性があります。モデルの改善が必要です。")
各newsgroupにおけるトピック分布の分析
元のカテゴリ(newsgroup)ごとにトピックの分布を分析することで、各カテゴリがどのトピックに強く関連しているかを理解できます。これにより、カテゴリ間の類似性や違いを明確にすることができます。
import seaborn as sns

# 例として、全てのカテゴリーを定義します
# 実際のデータに置き換えてください
all_categories = [
    'sci.crypt', 'comp.sys.mac.hardware', 'misc.forsale', 'soc.religion.christian', 'rec.sport.baseball',
    'rec.sport.hockey', 'comp.sys.ibm.pc.hardware', 'talk.politics.guns', 'rec.autos', 'alt.atheism',
    'comp.os.ms-windows.misc', 'sci.electronics', 'comp.windows.x', 'talk.religion.misc', 'talk.politics.mideast',
    'sci.med', 'rec.motorcycles', 'comp.graphics', 'sci.space', 'talk.politics.misc'
]

# カテゴリーを繰り返してリストを作成
newsgroup_labels = all_categories * (len(df_topic_dist) // len(all_categories) + 1)
newsgroup_labels = newsgroup_labels[:len(df_topic_dist)]  # データフレームの長さに合わせる

# newsgroup情報をデータフレームに追加
df_topic_dist['Newsgroup'] = newsgroup_labels

# 各トピックの平均分布をnewsgroupごとに計算
topic_newsgroup = df_topic_dist.groupby('Newsgroup').mean()

# ヒートマップで可視化
plt.figure(figsize=(12, 8))
sns.heatmap(topic_newsgroup, annot=True, cmap='viridis')
plt.title('Newsgroupごとのトピック分布の平均')
plt.ylabel('Newsgroup')
plt.xlabel('トピック')
plt.show()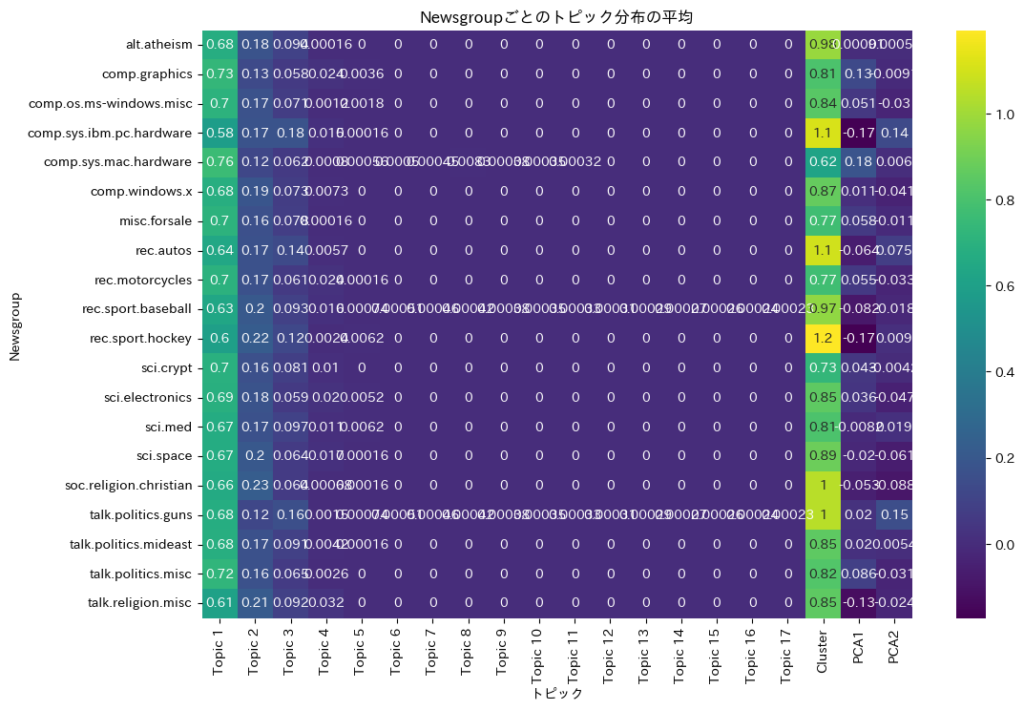
ヒートマップを使用することで、各newsgroupのトピック分布の特徴におけるトピックの強さ、newsgroup間の類似性と違い、トピックの重要性を視覚的に確認できます。これにより主要なトピックを特定することができ、データのパターンや関連性を理解することができます。
トピックの時間的変遷分析(タイムラインの作成)
もし文書にタイムスタンプ情報が含まれている場合、トピックの出現頻度や重要度が時間とともにどのように変化しているかを分析できます。これにより、特定のトピックのトレンドやシーズナリティを把握できます。
このコードを実行すると、以下のように上位5つのトピックの月別の平均分布が表示されます。
# 例として、各文書に対応する日付のリストを定義します
document_dates = pd.date_range(start='2020-01-01', periods=len(df_topic_dist), freq='D')

# 日付情報をデータフレームに追加
df_topic_dist['Date'] = document_dates
df_topic_dist['Date'] = pd.to_datetime(df_topic_dist['Date'])

# トピックの列名を取得
topic_columns = [col for col in df_topic_dist.columns if col.startswith('Topic')]

# 各トピックの出現頻度を計算
topic_frequencies = df_topic_dist[topic_columns].mean()
print("\nTopic frequencies:")
print(topic_frequencies[:5])

# 上位5つのトピックを選定
top_topic_indices = topic_frequencies.nlargest(5).index
print("\nTop 5 topics based on frequency:")
print(top_topic_indices)

# 数値データのみを使用してグループ化とトピックごとの月別の平均分布を計算
numeric_columns = df_topic_dist.select_dtypes(include=[float, int]).columns
monthly_topic = df_topic_dist.groupby(df_topic_dist['Date'].dt.to_period('M'))[numeric_columns].mean()

# 列名の確認
print("monthly_topic columns:", monthly_topic.columns)

# トレンドの可視化
plt.figure(figsize=(14, 7))
for topic_col in top_topic_indices:
    plt.plot(monthly_topic.index.astype(str), monthly_topic[topic_col], label=topic_col)
plt.xlabel('月')
plt.ylabel('トピック確率')
plt.title('月別のトピック分布(上位5トピック)')
plt.legend()
plt.xticks(rotation=45)
plt.show()
Topic frequencies:
Topic 1 0.674326
Topic 2 0.173993
Topic 3 0.089883
Topic 4 0.009857
Topic 5 0.001289
dtype: float64
Top 5 topics based on frequency:
Index(['Topic 1', 'Topic 2', 'Topic 3', 'Topic 4', 'Topic 5'], dtype='object')
monthly_topic columns: Index(['Topic 1', 'Topic 2', 'Topic 3', 'Topic 4', 'Topic 5', 'Topic 6',
'Topic 7', 'Topic 8', 'Topic 9', 'Topic 10', 'Topic 11', 'Topic 12',
'Topic 13', 'Topic 14', 'Topic 15', 'Topic 16', 'Topic 17', 'Cluster',
'PCA1', 'PCA2'],
dtype='object')
このコードは、各トピックが時間とともにどのように変化しているかを示すために、トピックごとの月別の平均分布を計算し、可視化しています。
- トピックのトレンド: 特定のトピックが増加傾向にあるのか、減少傾向にあるのかを確認できます。
- 季節性や周期性: トピックの出現頻度に季節性や周期性があるかどうかを検出できます。
- イベントの影響: 特定の期間にトピックが急増または急減する場合、その期間に関連するイベントや出来事の影響を考察できます。
この情報は、マーケティング戦略の立案やコンテンツの企画、トレンドの予測などに役立ちます。
トピックの類似性と階層構造の分析
トピック間の類似性を計算し、ヒートマップやトピックの階層構造、クラスタリングを行うことで、トピック同士の関連性やグループ化を視覚化することができます。
| 特徴 | ヒートマップ | トピックの階層構造 | クラスタリング |
|---|---|---|---|
| 目的 | データの相関や類似度を視覚化する | データの階層的な関係を視覚化する | データを類似性に基づいてグループ化する |
| 表現方法 | 色の濃淡で数値を表現 | ツリー構造で階層を表現 | データポイントをクラスタに分割 |
| 利点 | 全体的なパターンや相関関係を把握しやすい | 階層的な関係や構造を明確に示す | 自然なグループやパターンを発見できる |
| 使用例 | トピック間のコサイン類似度の視覚化 | トピック間の階層的な関係の視覚化 | データの分類やセグメンテーション |
このコードを実行すると、以下のようにトピック間のコサイン類似度を示すヒートマップが表示されます。ヒートマップのラベルは df_topic_dist.columns に基づいて動的に設定されます。
from sklearn.metrics.pairwise import cosine_similarity
import seaborn as sns
import matplotlib.pyplot as plt

# トピック間の類似度行列を計算
topic_matrix = lda_model.get_topics()
similarity_matrix = cosine_similarity(topic_matrix)

# トピックの列名を取得
topic_columns = [col for col in df_topic_dist.columns if col.startswith('Topic')]

# ヒートマップで可視化
plt.figure(figsize=(10, 8))
sns.heatmap(similarity_matrix, annot=True, cmap='coolwarm', xticklabels=topic_columns, yticklabels=topic_columns)
plt.title('トピック間のコサイン類似度')
plt.show()
これらの手法は、それぞれ異なる目的と利点を持ち、データの関係性やパターンを理解するために補完的に使用されることが多いです。
新しい文書の分類(分類モデルへの応用)
LDAによって得られたトピック分布を特徴量として利用し、機械学習の分類モデル(例:ロジスティック回帰、サポートベクターマシン)を構築することで、新しい文書のカテゴリ予測を行えます。
from sklearn.model_selection import train_test_split
from sklearn.linear_model import LogisticRegression
from sklearn.metrics import classification_report

# 特徴量とラベルの準備
X = df_topic_dist.drop(['Cluster', 'PCA1', 'PCA2', 'Newsgroup', 'Date'], axis=1)
y = newsgroup_labels  # 各文書のカテゴリラベル

# データの分割
X_train, X_test, y_train, y_test = train_test_split(X, y, test_size=0.2, random_state=42)

# ロジスティック回帰モデルの訓練
clf = LogisticRegression(max_iter=1000)
clf.fit(X_train, y_train)

# 予測と評価
y_pred = clf.predict(X_test)
print(classification_report(y_test, y_pred))
トピックのキーワード抽出とラベリング
各トピックの上位キーワードを基に、トピックに対して意味のあるラベルを付けることで、トピックの内容を直感的に理解できます。
# df_topic_distのカラムデータを確認
print(df_topic_dist.columns)

# 各トピックの上位キーワードを基にラベルを作成
topic_labels = {}
for idx, topic in lda_model.print_topics(-1):
    if f'Topic {idx}' in df_topic_dist.columns:
        words = topic.split("+")
        top_words = [word.split("*")[1].strip('"') for word in words[:3]]  # 上位3単語を抽出
        topic_labels[idx] = ", ".join(top_words)

# トピックラベルの表示
for idx, label in topic_labels.items():
    print(f'Topic {idx}: {label}')
Topic 1: car" , dealer" , saturn"
Topic 2: subject" , document_id" , newsgroup"
Topic 3: subject" , document_id" , newsgroup"
Topic 4: edu" , com" , nasa"
Topic 5: canberra" , subject" , au"
Topic 6: subject" , document_id" , newsgroup"
Topic 7: document" , edu" , com"
Topic 8: situation" , team" , runs"
Topic 9: people" , believe" , edu"
Topic 10: course" , edu" , uic"
Topic 11: subject" , edu" , newsgroup"
Topic 12: document_id" , newsgroup" , subject"
Topic 13: ottawa" , lindros" , give"
Topic 14: edu" , bit" , subject"
Topic 15: windows" , comp" , misc"
Topic 16: lunar" , tele" , model" トピックの可視化(t-SNEやUMAPの利用)
高次元のトピック分布を2次元または3次元に次元削減し、視覚的にトピック間の関係性を確認します。t-SNEやUMAPを使用することで、データのクラスタリングや構造をより明確に把握できます。
t-SNEの場合
from sklearn.manifold import TSNE
import seaborn as sns
import matplotlib.pyplot as plt
import pandas as pd

# カラム列の確認
print(df_topic_dist.columns)

# トピック列を取得
topic_columns = [col for col in df_topic_dist.columns if col.startswith('Topic')]

# 特徴量の準備
X = df_topic_dist[topic_columns]

# t-SNEによる次元削減
tsne = TSNE(n_components=2, random_state=42)
tsne_results = tsne.fit_transform(X)

# データフレームに追加
df_topic_dist['TSNE1'] = tsne_results[:, 0]
df_topic_dist['TSNE2'] = tsne_results[:, 1]

# クラスタごとのトピック分布の平均を計算
cluster_topic_means = df_topic_dist.groupby('Cluster')[topic_columns].mean()

# クラスタごとのトピック分布の平均を表示
print(cluster_topic_means)

# 可視化
plt.figure(figsize=(10, 8))
sns.scatterplot(x='TSNE1', y='TSNE2', hue='Cluster', palette='viridis', data=df_topic_dist, legend='full')
plt.title('t-SNEによるトピック分布の可視化')
plt.show()
Topic 1 Topic 2 Topic 3 Topic 4 Topic 5 Topic 6 Topic 7 \
Cluster
0 0.945247 0.007525 0.000259 0.000200 0.000175 0.000040 0.000036
1 0.132500 0.268176 0.408791 0.121589 0.015484 0.000000 0.000000
2 0.469471 0.469950 0.006198 0.003414 0.000000 0.000000 0.000000
3 0.047880 0.858181 0.028479 0.001096 0.000591 0.000526 0.000474
4 0.022516 0.028508 0.876967 0.005307 0.000000 0.000000 0.000000
Topic 8 Topic 9 Topic 10 Topic 11 Topic 12 Topic 13 Topic 14 \
Cluster
0 0.000670 0.000030 0.000028 0.000026 0.000000 0.000000 0.00000
1 0.000000 0.000000 0.000000 0.000000 0.000000 0.000000 0.00000
2 0.000000 0.000000 0.000000 0.000000 0.000000 0.000000 0.00000
3 0.000432 0.000396 0.000366 0.000340 0.000318 0.000298 0.00028
4 0.000000 0.000000 0.000000 0.000000 0.000000 0.000000 0.00000
Topic 15 Topic 16 Topic 17
Cluster
0 0.000000 0.000000 0.000000
1 0.000000 0.000000 0.000000
2 0.000000 0.000000 0.000000
3 0.000265 0.000251 0.000239
4 0.000000 0.000000 0.000000 
UMAPの場合:
import umap
import seaborn as sns
import matplotlib.pyplot as plt

# UMAPによる次元削減
umap_model = umap.UMAP(n_components=2, random_state=42)
umap_results = umap_model.fit_transform(X)

# データフレームに追加
df_topic_dist['UMAP1'] = umap_results[:, 0]
df_topic_dist['UMAP2'] = umap_results[:, 1]

# 可視化
plt.figure(figsize=(10, 8))
sns.scatterplot(x='UMAP1', y='UMAP2', hue='Cluster', palette='viridis', data=df_topic_dist, legend='full')
plt.title('UMAPによるトピック分布の可視化')
plt.show()
UMAP(Uniform Manifold Approximation and Projection)は、高次元データの次元削減手法の一つで、t-SNEと同様にデータの低次元表現を提供します。UMAPは、特に大規模データセットに対して高速であり、局所的な構造と大域的な構造の両方を保持する能力があります。
LDAの有効な分析用途
| 用途 | 目的 | 例 |
|---|---|---|
| トピック抽出 | 文書集合に潜在するトピックを抽出し、各文書がどのトピックに関連しているかを明らかにする。 | ニュース記事、学術論文、ソーシャルメディア投稿などの大規模なテキストデータから主要なトピックを抽出する。 |
| 文書分類 | 文書をトピックに基づいて分類する。 | 顧客レビューをトピックに基づいて分類し、製品の特定の側面に関する意見を分析する。 |
| トレンド分析 | 時系列データにおけるトピックの出現頻度を分析し、トレンドを把握する。 | ニュース記事のトピックの時間的な変化を分析し、特定のトピックがどの時期に注目されているかを把握する。 |
| クラスタリング | 文書をトピックに基づいてクラスタリングし、類似した文書をグループ化する。 | 類似した研究論文をグループ化し、研究分野の全体像を把握する。 |
| 情報検索 | トピックに基づいて文書を検索し、関連性の高い文書を効率的に見つける。 | 特定のトピックに関連するニュース記事や学術論文を検索する。 |
| 感情分析 | トピックに基づいて感情分析を行い、特定のトピックに対する感情の傾向を把握する。 | ソーシャルメディア投稿をトピックに基づいて分類し、各トピックに対する感情の傾向を分析する。 |
LDAは、文書集合に潜在するトピックを発見し、文書をトピックに基づいて分類・クラスタリングするための強力な手法です。ただし、トピック数の事前設定や単語の順序を無視する点などの限界もあります。
LDAの応用例
Kaggleの場合:
- データセット:ニュース記事やレビューなどのテキストデータ
- 応用:顧客の声から主要なトピックを抽出し、製品改善に活用
ビジネスの場合:
- マーケティング戦略:顧客の興味や関心を把握し、ターゲット広告を最適化
- 情報整理:大量の文書データから主要なトピックを抽出し、情報検索を効率化
オートエンコーダ
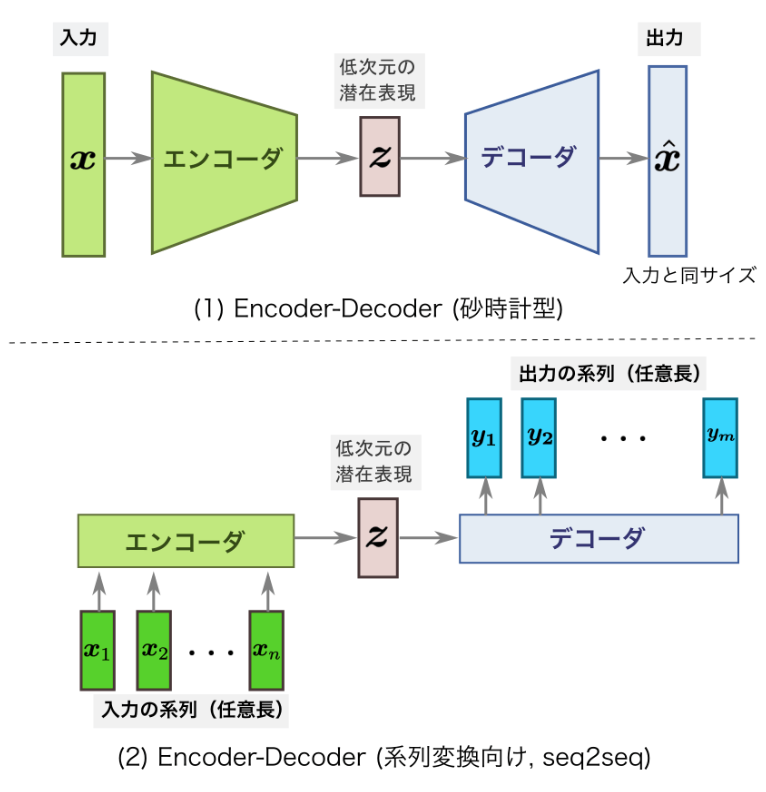
オートエンコーダは、教師なし学習に基づくニューラルネットワークの一種で、データを低次元に圧縮し、元のデータを再構成するモデルです。主にデータの次元削減や特徴抽出、異常検知、生成モデルとして使用されます。
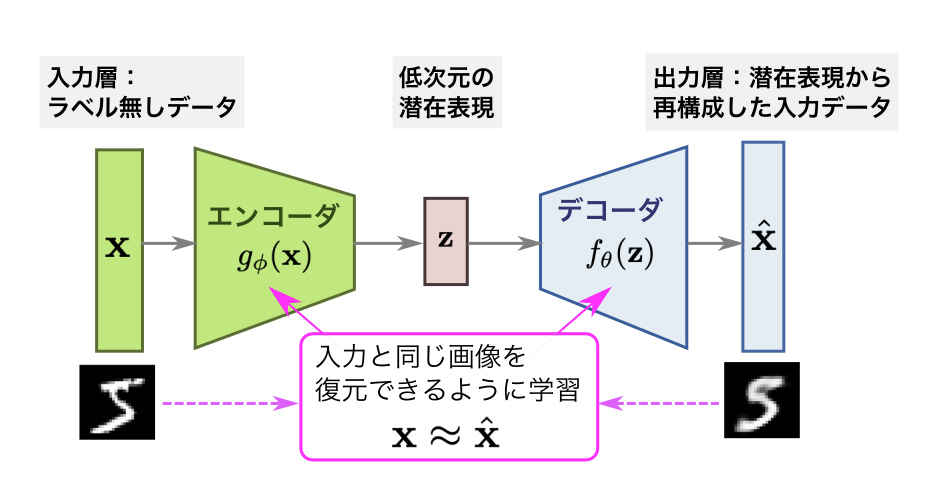
オートエンコーダは以下の2つの部分から構成されます。
エンコーダ(Encoder)
入力データ $x$ を、より低次元の潜在表現(潜在空間) $z$ に変換します。
$$\mathbf{z} = g_{\phi}(\mathbf{x}) = \sigma(\mathbf{W}_e \mathbf{x} + \mathbf{b}_e)$$
- $W_e$ : エンコーダの重み行列
- $b_e$ : エンコーダのバイアス
- $σ$ : 活性化関数(例:ReLU, Sigmoid など)
- $z$ は低次元の特徴ベクトルで、入力データの本質的な情報を圧縮した表現です。
デコーダ(Decoder)
潜在表現 $z$ から元のデータを再構成します。
$$\hat{\mathbf{x}} = f_{\theta}(\mathbf{z}) = \sigma(\mathbf{W}_d \mathbf{z} + \mathbf{b}_d)$$
- $W_d$ : デコーダの重み行列
- $b_d$ : デコーダのバイアス
- 再構成されたデータ $\hat{\mathbf{x}}$ は、入力データ $\mathbf{x}$ に近似します。
全体の動作:オートエンコーダの全体的なプロセスは次のように表現されます。
$$\hat{\mathbf{x}} = f_{\theta}(g_{\phi}(\mathbf{x}))$$
- 入力 $\mathbf{x}$ をエンコーダで潜在表現 $\mathbf{z}$ に変換し、それをデコーダで再構成して $\hat{\mathbf{x}}$ を得ます。
- 学習の目標は、再構成誤差(損失)を最小化することです。
損失関数
オートエンコーダの損失関数は、再構成されたデータ $\hat{\mathbf{x}}$ と元データ$\mathbf{x}$ の差を表します。通常、以下のような再構成誤差が使われます。
$$\mathcal{L}(\mathbf{x}, \hat{\mathbf{x}}) = \|\mathbf{x} – \hat{\mathbf{x}}\|^2$$
平均二乗誤差(MSE)
入力が連続値の場合に適用され、再構成誤差を計算します。
$$L(\mathbf{x}, \hat{\mathbf{x}}) = \frac{1}{N} \sum_{i=1}^{N} \|\mathbf{x}_i – \hat{\mathbf{x}}_i\|^2$$
- $x_i$ : 入力データの $i$ 番目の要素
- $\hat{\mathbf{x}}$ : 再構成されたデータの iii 番目の要素
- $N$ : データの要素数
バイナリクロスエントロピー(BCE)
入力データが二値データ(例: 0 または 1)の場合に適用されます。
$$L(\mathbf{x}, \hat{\mathbf{x}}) = -\frac{1}{N} \sum_{i=1}^{N} \left[ \mathbf{x}_i \log(\hat{\mathbf{x}}_i) + (1 – \mathbf{x}_i) \log(1 – \hat{\mathbf{x}}_i) \right]$$
- BCEは、二値データに適した誤差計算を行うことで、再構成精度を高めます。
学習プロセス
オートエンコーダは以下の手順で学習を行います。
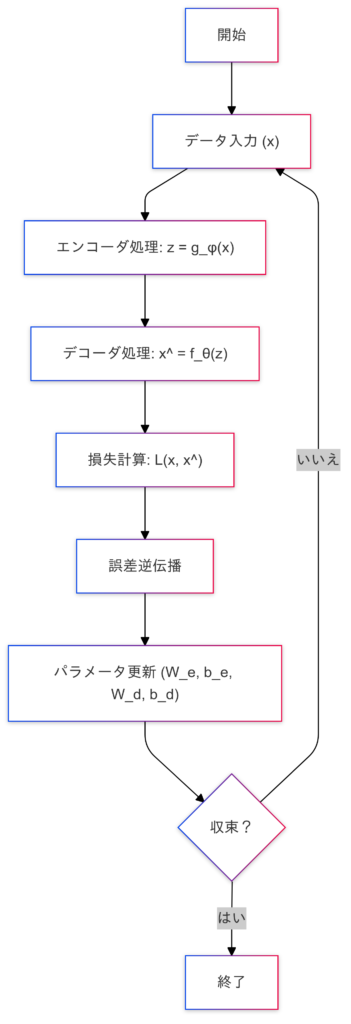
オートエンコーダ図の詳細説明
入力層(ラベルなしデータ):
- $\mathbf{x}$ : 高次元の入力データ(例:画像やテキストデータ)
- 図では「手書き数字画像」が入力されています。
エンコーダ($g_\phi$):
- 入力 $\mathbf{x}$ を潜在表現 $\mathbf{z}$ に圧縮します。
- 潜在空間は、元データの次元を削減し、本質的な特徴を保持する低次元表現です。
潜在表現(低次元の潜在空間):
- $\mathbf{z}$ : エンコーダで得られる低次元の特徴ベクトル。
- 図では中央に配置されており、「本質的な情報」を保持しています。
デコーダ($f_\theta$):
- 潜在表現 $\mathbf{z}$ を再構成し、元のデータに近づけます。
出力層(再構成データ):
- $\hat{\mathbf{x}}$ : デコーダによって生成された再構成データ。
- 入力 $\mathbf{x}$ に非常に近いデータが出力されます。
オートエンコーダの実装
今回のオートエンコーダの実装には、MNISTデータセットを使用します。
MNISTデータセットについて
オートエンコーダは、入力データを低次元の潜在空間に圧縮し、再構成するアルゴリズムです。MNISTのような画像データは、再構成の結果を視覚的に確認しやすく、アルゴリズムの効果を直感的に理解することができます。
オートエンコーダを使った異常検知のポイント
オートエンコーダを使った異常検知のポイントは、正常データで訓練されたモデルが異常データを再構成する際に大きな誤差を示すことを利用して、再構成誤差が閾値を超えるデータを異常と判断することです。また、潜在空間の可視化を通じて、データのクラスタリングや分布を視覚的に確認します。
| ステップ | 説明 |
|---|---|
| データの準備と前処理 | MNISTデータセットをロードし、正規化して整形。データローダーを作成。 |
| オートエンコーダモデルの定義 | エンコーダとデコーダからなるモデルを定義。潜在空間の次元数を設定。 |
| モデルの訓練 | MSE損失関数とAdam最適化手法を使用してモデルを訓練。訓練損失と検証損失を計算。 |
| 潜在空間の抽出と可視化 | 訓練済みモデルを使用してテストデータの潜在空間表現を抽出し、2次元プロットで可視化。 |
| 再構成データの取得と可視化 | 訓練済みモデルを使用してテストデータを再構成。元画像と再構成画像を比較して可視化。 |
| 再構成誤差の計算 | 再構成誤差を計算し、各データポイントの誤差を求める。 |
| 異常データの検出 | 再構成誤差の95パーセンタイルを閾値として設定し、異常データを検出。異常データの数を表示。 |
データの準備と前処理
import torch
from torch import nn, optim
from torch.utils.data import DataLoader, TensorDataset
from torchvision import datasets, transforms
import matplotlib.pyplot as plt
import numpy as np
# データの変換(正規化)
transform = transforms.Compose([
transforms.ToTensor(),
transforms.Normalize((0.5,), (0.5,))
])
# MNISTデータセットのロード
train_dataset = datasets.MNIST(root='./data', train=True, download=True, transform=transform)
test_dataset = datasets.MNIST(root='./data', train=False, download=True, transform=transform)
# データの準備
x_train = train_dataset.data.numpy()
x_test = test_dataset.data.numpy()
# データの正規化と整形
x_train = torch.tensor(x_train, dtype=torch.float32).view(-1, 784) / 255.0 # 28x28の画像を784次元のベクトルに変換
x_test = torch.tensor(x_test, dtype=torch.float32).view(-1, 784) / 255.0 # 同様に変換
# 入力次元
input_dim = x_train.shape[1]
latent_dim = 2 # 潜在空間の次元数を2に設定
# データローダーの作成
train_dataset = TensorDataset(x_train, x_train)
test_dataset = TensorDataset(x_test, x_test)
train_loader = DataLoader(train_dataset, batch_size=256, shuffle=True)
test_loader = DataLoader(test_dataset, batch_size=256, shuffle=False)
# データセットのサイズを確認
print(f'Training dataset size: {len(train_dataset)}')
print(f'Test dataset size: {len(test_dataset)}')
print(f'Total dataset size: {len(train_dataset) + len(test_dataset)}')Training dataset size: 60000
Test dataset size: 10000
Total dataset size: 70000訓練データに60000データ、テストデータに10000データを使用します。また、正規化を行い、潜在空間の次元数を設定します。
モデルの構築
# オートエンコーダモデルの定義
class Autoencoder(nn.Module):
    def __init__(self, input_dim, latent_dim):
        super(Autoencoder, self).__init__()
        # エンコーダ部分
        self.encoder = nn.Sequential(
            nn.Linear(input_dim, 128),
            nn.ReLU(),
            nn.Linear(128, latent_dim)
        )
        # デコーダ部分
        self.decoder = nn.Sequential(
            nn.Linear(latent_dim, 128),
            nn.ReLU(),
            nn.Linear(128, input_dim),
            nn.Sigmoid()
        )

    def forward(self, x):
        encoded = self.encoder(x)
        decoded = self.decoder(encoded)
        return encoded, decoded

# モデルのインスタンス化
autoencoder = Autoencoder(input_dim, latent_dim)
オートエンコーダモデルの定義(エンコーダ・デコーダ)とモデルのインスタンス化を行います。
input_dim: 入力データの次元数(例:MNISTデータセットの場合は784)latent_dim: 潜在空間の次元数(例:2次元の潜在空間に圧縮する場合は2)
モデルのコンパイルと学習
# 損失関数と最適化手法の定義
criterion = nn.MSELoss()
optimizer = optim.Adam(autoencoder.parameters(), lr=0.001)

# モデルの訓練
num_epochs = 50
for epoch in range(num_epochs):
    autoencoder.train()
    train_loss = 0
    for data in train_loader:
        inputs, _ = data
        optimizer.zero_grad()
        encoded, outputs = autoencoder(inputs)
        loss = criterion(outputs, inputs)
        loss.backward()
        optimizer.step()
        train_loss += loss.item()

    train_loss /= len(train_loader)

    # 検証
    autoencoder.eval()
    val_loss = 0
    with torch.no_grad():
        for data in test_loader:
            inputs, _ = data
            encoded, outputs = autoencoder(inputs)
            loss = criterion(outputs, inputs)
            val_loss += loss.item()

    val_loss /= len(test_loader)

    print(f'Epoch [{epoch+1}/{num_epochs}], Train Loss: {train_loss:.4f}, Validation Loss: {val_loss:.4f}')
Epoch [47/50], Train Loss: 0.0408, Validation Loss: 0.0418
Epoch [48/50], Train Loss: 0.0408, Validation Loss: 0.0418
Epoch [49/50], Train Loss: 0.0407, Validation Loss: 0.0417
Epoch [50/50], Train Loss: 0.0407, Validation Loss: 0.0416損失関数は 0~1の範囲で正規化を行なっているので画像データセットの場合は一般的にはMSE(平均二乗誤差)を使用します。最適化アルゴリズムはAdamを使用しています。
潜在空間の可視化
潜在空間を2次元に可視化すると、データの分布やクラスタ構造が観察できます。
# 潜在空間の抽出
autoencoder.eval()
with torch.no_grad():
    encoded_imgs, _ = autoencoder(x_test)

# 2次元プロット
plt.scatter(encoded_imgs[:, 0].numpy(), encoded_imgs[:, 1].numpy(), c='blue')
plt.colorbar()
plt.show()
元データと再構成データの比較
# 再構成データの取得
autoencoder.eval()
with torch.no_grad():
    _, decoded_imgs = autoencoder(x_test)

# 元画像と再構成画像のプロット
n = 10  # 表示する画像の数
plt.figure(figsize=(20, 4))
for i in range(n):
    # 元画像
    ax = plt.subplot(2, n, i + 1)
    plt.imshow(x_test[i].reshape(28, 28).numpy(), cmap='gray')
    plt.title("Original")
    plt.axis('off')

    # 再構成画像
    ax = plt.subplot(2, n, i + n + 1)
    plt.imshow(decoded_imgs[i].reshape(28, 28).numpy(), cmap='gray')
    plt.title("Reconstructed")
    plt.axis('off')
plt.show()
再構成した画像はぼやけて見えてしまっています。
異常検知
オートエンコーダは、正常データで学習し、異常データを再構成しにくい特性を利用して異常検知に応用できます。
# 再構成誤差の計算
autoencoder.eval()
with torch.no_grad():
    _, decoded_imgs = autoencoder(x_test)

reconstruction_error = torch.mean((x_test - decoded_imgs) ** 2, dim=1).numpy()

# 閾値設定(例:95パーセンタイル)
threshold = np.percentile(reconstruction_error, 95)

# 異常データの検出
anomalies = reconstruction_error > threshold

# 結果の表示
print(f'Reconstruction error threshold: {threshold}')
print(f'Number of anomalies detected: {np.sum(anomalies)}')
Reconstruction error threshold: 0.07821197658777235
Number of anomalies detected: 500再構成エラーの閾値は0.0782、検出された異常の数は500です。
再構成した画像がぼやけて見える原因と対策
| 要因 | 説明 |
|---|---|
| モデルの容量不足 | エンコーダやデコーダの層やユニット数が少ないと、データの複雑な特徴を十分に学習できない可能性があります。 |
| 潜在空間の次元数 | 潜在空間の次元数が低すぎると、データの重要な特徴が保持できず、再構成された画像がぼやけることがあります。 |
| 訓練データの不足 | 訓練データが少ないと、モデルがデータのパターンを十分に学習できない可能性があります。 |
| 訓練エポック数の不足 | 訓練エポック数が少ないと、モデルが十分に収束せず、再構成された画像がぼやけることがあります。 |
| 損失関数の選択 | 適切な損失関数を選ばないと、モデルの学習がうまくいかない場合があります。MSEは一般的に再構成に適していますが、他の損失関数も試す価値があります。 |
具体的には、モデルの層の数やユニット数を増やし、潜在空間の次元数を調整し、訓練エポック数を増やすことが有効ですので一度試してみようと思います。
再構成された画像の品質を向上させてみる
import torch
from torch import nn, optim
from torch.utils.data import DataLoader, TensorDataset
from torchvision import datasets, transforms
import matplotlib.pyplot as plt
import numpy as np

# データの変換(正規化)
transform = transforms.Compose([
    transforms.ToTensor(),
    transforms.Normalize((0.5,), (0.5,))
])

# MNISTデータセットのロード
train_dataset = datasets.MNIST(root='./data', train=True, download=True, transform=transform)
test_dataset = datasets.MNIST(root='./data', train=False, download=True, transform=transform)

# データの準備
x_train = train_dataset.data.numpy()
x_test = test_dataset.data.numpy()

# データの正規化と整形
x_train = torch.tensor(x_train, dtype=torch.float32).view(-1, 784) / 255.0  # 28x28の画像を784次元のベクトルに変換
x_test = torch.tensor(x_test, dtype=torch.float32).view(-1, 784) / 255.0  # 同様に変換

# 入力次元
input_dim = x_train.shape[1]
latent_dim = 10  # 潜在空間の次元数を10に設定

# データローダーの作成
train_dataset = TensorDataset(x_train, x_train)
test_dataset = TensorDataset(x_test, x_test)
train_loader = DataLoader(train_dataset, batch_size=256, shuffle=True)
test_loader = DataLoader(test_dataset, batch_size=256, shuffle=False)

# データセットのサイズを確認
print(f'Training dataset size: {len(train_dataset)}')
print(f'Test dataset size: {len(test_dataset)}')
print(f'Total dataset size: {len(train_dataset) + len(test_dataset)}')

# オートエンコーダモデルの定義
class Autoencoder(nn.Module):
    def __init__(self, input_dim, latent_dim):
        super(Autoencoder, self).__init__()
        # エンコーダ部分
        self.encoder = nn.Sequential(
            nn.Linear(input_dim, 512),
            nn.ReLU(),
            nn.Linear(512, 256),
            nn.ReLU(),
            nn.Linear(256, 128),
            nn.ReLU(),
            nn.Linear(128, latent_dim)
        )
        # デコーダ部分
        self.decoder = nn.Sequential(
            nn.Linear(latent_dim, 128),
            nn.ReLU(),
            nn.Linear(128, 256),
            nn.ReLU(),
            nn.Linear(256, 512),
            nn.ReLU(),
            nn.Linear(512, input_dim),
            nn.Sigmoid()
        )

    def forward(self, x):
        encoded = self.encoder(x)
        decoded = self.decoder(encoded)
        return encoded, decoded

# モデルのインスタンス化
autoencoder = Autoencoder(input_dim, latent_dim)

# 損失関数と最適化手法の定義
criterion = nn.MSELoss()  # MSEを使用
optimizer = optim.Adam(autoencoder.parameters(), lr=0.001)

# モデルの訓練
num_epochs = 100  # エポック数を増やす
for epoch in range(num_epochs):
    autoencoder.train()
    train_loss = 0
    for data in train_loader:
        inputs, _ = data
        optimizer.zero_grad()
        encoded, outputs = autoencoder(inputs)
        loss = criterion(outputs, inputs)
        loss.backward()
        optimizer.step()
        train_loss += loss.item()

    train_loss /= len(train_loader)

    # 検証
    autoencoder.eval()
    val_loss = 0
    with torch.no_grad():
        for data in test_loader:
            inputs, _ = data
            encoded, outputs = autoencoder(inputs)
            loss = criterion(outputs, inputs)
            val_loss += loss.item()

    val_loss /= len(test_loader)

    print(f'Epoch [{epoch+1}/{num_epochs}], Train Loss: {train_loss:.4f}, Validation Loss: {val_loss:.4f}')

# 再構成データの取得
autoencoder.eval()
with torch.no_grad():
    _, decoded_imgs = autoencoder(x_test)

# 元画像と再構成画像のプロット
n = 10  # 表示する画像の数
plt.figure(figsize=(20, 4))
for i in range(n):
    # 元画像
    ax = plt.subplot(2, n, i + 1)
    plt.imshow(x_test[i].reshape(28, 28).numpy(), cmap='gray')
    plt.title("Original")
    plt.axis('off')

    # 再構成画像
    ax = plt.subplot(2, n, i + n + 1)
    plt.imshow(decoded_imgs[i].reshape(28, 28).numpy(), cmap='gray')
    plt.title("Reconstructed")
    plt.axis('off')
plt.show()

# 再構成誤差の計算
autoencoder.eval()
with torch.no_grad():
    _, decoded_imgs = autoencoder(x_test)

reconstruction_error = torch.mean((x_test - decoded_imgs) ** 2, dim=1).numpy()

# 閾値設定(例:95パーセンタイル)
threshold = np.percentile(reconstruction_error, 95)

# 異常データの検出
anomalies = reconstruction_error > threshold

# 結果の表示
print(f'Reconstruction error threshold: {threshold}')
print(f'Number of anomalies detected: {np.sum(anomalies)}')
Epoch [97/100], Train Loss: 0.0088, Validation Loss: 0.0113
Epoch [98/100], Train Loss: 0.0088, Validation Loss: 0.0111
Epoch [99/100], Train Loss: 0.0088, Validation Loss: 0.0113
Epoch [100/100], Train Loss: 0.0088, Validation Loss: 0.0112
Reconstruction error threshold: 0.026963128056377166
Number of anomalies detected: 500
先ほどの画像よりも鮮明に見えます。また再構成エラーの閾値の精度もよくなっています。
データノイズの除去
これだけでもある程度の精度はよくなりますが、もう少しデータノイズの除去を行う方法としてデノイジングオートエンコーダを用いるという方法があります。
デノイジングオートエンコーダとは?
デノイジングオートエンコーダ(DAE)は、オートエンコーダの拡張版で、入力データにノイズを加えた状態から、元のクリーンなデータを復元することを目的としたニューラルネットワークです。主にデータの頑健性を高めることや、より一般的な特徴を学習するために使用されます。
- 通常のオートエンコーダ:
- 入力データ $x$ をエンコーダとデコーダを通じて再構成し、元のデータをそのまま復元することを目標とします。
- デノイジングオートエンコーダ:
- ノイズが加えられた入力データ $\tilde{x}$ を与え、元のクリーンなデータ $x$ を復元するように学習します。
学習プロセス
デノイジングオートエンコーダは以下の手順で学習を行います。

ノイズ付加
- 入力データ $\mathbf{x}$ にノイズ $\eta$ を加え、$\tilde{\mathbf{x}} = \mathbf{x} + \eta$ を作成。
エンコーダ
ノイズ付きデータ $\tilde{\mathbf{x}}$ を圧縮し、潜在表現 $\mathbf{z}$ に変換。
$$\mathbf{z} = g_{\phi}(\tilde{\mathbf{x}}) = \sigma(\mathbf{W}_e \tilde{\mathbf{x}} + \mathbf{b}_e)$$
- $g_ϕ$ : エンコーダの関数
- $\mathbf{W}_e, \mathbf{b}_e$ : エンコーダの重みとバイアス
- $\sigma$ : 活性化関数
デコーダ
潜在表現 $\mathbf{z}$ から元のデータ $\hat{\mathbf{x}}$ を再構成。
$$\hat{\mathbf{x}} = f_{\theta}(\mathbf{z}) = \sigma(\mathbf{W}_d \mathbf{z} + \mathbf{b}_d)$$
- $f_θ$ : デコーダの関数
- $\mathbf{W}_d, \mathbf{b}_d$ : デコーダの重みとバイアス
損失関数
再構成されたデータ $\hat{\mathbf{x}}$ と元データ $\mathbf{x}$ の間の差を最小化します。
$$\mathcal{L}(\mathbf{x}, \hat{\mathbf{x}}) = \|\mathbf{x} – \hat{\mathbf{x}}\|^2$$
- ノイズ付きデータ $\tilde{\mathbf{x}}$ ではなく、元データ $\mathbf{x}$ との誤差を計算する点が重要です。
デノイジングオートエンコーダを使うメリット
- 入力データが不完全、またはノイズを含む場合に適用可能。
- 一般的なデータ分布を学習するため、過学習を防ぐ効果があります。
- 強力なデータ前処理手法として使用でき、特に画像や音声データのノイズ除去に有効。
ノイズの種類
- ガウスノイズ
- データにランダムなガウス分布のノイズを加える。
- 例) $\tilde{\mathbf{x}} = \mathbf{x} + \eta, \quad \eta \sim \mathcal{N}(0, \sigma^2)$
- ドロップアウトノイズ
- 入力データの一部の値をランダムにゼロにする。
- 例) $\tilde{\mathbf{x}} = \mathbf{x} \cdot \mathbf{m}, \mathbf{m}$ はランダムマスク。
- スパイクノイズ
- 特定の値を大きく変動させる(例 : ピクセル値をランダムに置き換える)。
応用例
- ノイズ除去
- 画像や音声データのクリーンアップ(例: 手書き文字認識でノイズを除去)。
- 例) 汚れた画像から元の画像を復元。
- 異常検知
- 再構成誤差が大きいデータを異常とみなす。
- 例) 正常データに基づく異常検出システム。
- 前処理ステップ
- データ前処理として、ノイズを除去し、モデルの性能を向上。
様々なオートエンコーダモデル
| モデル | 目的 | 特徴 |
|---|---|---|
| オートエンコーダ | 再構成 | 入力データをそのまま復元 |
| デノイジングオートエンコーダ | ノイズ除去 | ノイズ付きデータから元のデータを復元 |
| 変分オートエンコーダ | データ生成 | 潜在空間に確率分布を導入し、新しいデータを生成可能 |
| スパースオートエンコーダ | 特徴抽出 | 潜在空間の値の一部をゼロにすることでスパース性を持つ特徴を学習 |
デノイジングオートエンコーダの実装
オートエンコーダと同じMNISTのデータを使ってデノイジングオートエンコーダを実装します。ノイズはガウスノイズを使います。
データの準備と正規化
import torch
from torch import nn, optim
from torch.utils.data import DataLoader, TensorDataset
from torchvision import datasets, transforms
import matplotlib.pyplot as plt
import numpy as np

# データの変換(正規化)
transform = transforms.Compose([
    transforms.ToTensor(),
    transforms.Normalize((0.5,), (0.5,))
])

# MNISTデータセットのロード
train_dataset = datasets.MNIST(root='./data', train=True, download=True, transform=transform)
test_dataset = datasets.MNIST(root='./data', train=False, download=True, transform=transform)

# データの準備
x_train = train_dataset.data.numpy()
x_test = test_dataset.data.numpy()

# データの正規化と整形
x_train = torch.tensor(x_train, dtype=torch.float32).view(-1, 784) / 255.0  # 28x28の画像を784次元のベクトルに変換
x_test = torch.tensor(x_test, dtype=torch.float32).view(-1, 784) / 255.0  # 同様に変換
ノイズを加えたデータの作成
noise_factor = 0.5
x_train_noisy = x_train + noise_factor * torch.randn(*x_train.shape)
x_test_noisy = x_test + noise_factor * torch.randn(*x_test.shape)
x_train_noisy = torch.clamp(x_train_noisy, 0., 1.)
x_test_noisy = torch.clamp(x_test_noisy, 0., 1.)
ガウスノイズを加えたデータを作成し、値を0から1の範囲にクリップします。
# 入力次元
input_dim = x_train.shape[1]
latent_dim = 10  # 潜在空間の次元数を10に設定
データローダーの作成
train_dataset = TensorDataset(x_train_noisy, x_train)
test_dataset = TensorDataset(x_test_noisy, x_test)
train_loader = DataLoader(train_dataset, batch_size=256, shuffle=True)
test_loader = DataLoader(test_dataset, batch_size=256, shuffle=False)
ノイズを加えたデータを入力として、クリーンなデータをターゲットとしてデータローダーを作成します。
# データセットのサイズを確認
print(f'Training dataset size: {len(train_dataset)}')
print(f'Test dataset size: {len(test_dataset)}')
print(f'Total dataset size: {len(train_dataset) + len(test_dataset)}')

# デノイジングオートエンコーダモデルの定義
class DenoisingAutoencoder(nn.Module):
    def __init__(self, input_dim, latent_dim):
        super(DenoisingAutoencoder, self).__init__()
        # エンコーダ部分
        self.encoder = nn.Sequential(
            nn.Linear(input_dim, 512),
            nn.ReLU(),
            nn.Linear(512, 256),
            nn.ReLU(),
            nn.Linear(256, 128),
            nn.ReLU(),
            nn.Linear(128, latent_dim)
        )
        # デコーダ部分
        self.decoder = nn.Sequential(
            nn.Linear(latent_dim, 128),
            nn.ReLU(),
            nn.Linear(128, 256),
            nn.ReLU(),
            nn.Linear(256, 512),
            nn.ReLU(),
            nn.Linear(512, input_dim),
            nn.Sigmoid()
        )

    def forward(self, x):
        encoded = self.encoder(x)
        decoded = self.decoder(encoded)
        return encoded, decoded

# モデルのインスタンス化
autoencoder = DenoisingAutoencoder(input_dim, latent_dim)

# 損失関数と最適化手法の定義
criterion = nn.MSELoss()  # MSEを使用
optimizer = optim.Adam(autoencoder.parameters(), lr=0.001)

# モデルの訓練
num_epochs = 100  # エポック数を増やす
for epoch in range(num_epochs):
    autoencoder.train()
    train_loss = 0
    for data in train_loader:
        inputs, targets = data
        optimizer.zero_grad()
        encoded, outputs = autoencoder(inputs)
        loss = criterion(outputs, targets)
        loss.backward()
        optimizer.step()
        train_loss += loss.item()

    train_loss /= len(train_loader)

    # 検証
    autoencoder.eval()
    val_loss = 0
    with torch.no_grad():
        for data in test_loader:
            inputs, targets = data
            encoded, outputs = autoencoder(inputs)
            loss = criterion(outputs, targets)
            val_loss += loss.item()

    val_loss /= len(test_loader)

    print(f'Epoch [{epoch+1}/{num_epochs}], Train Loss: {train_loss:.4f}, Validation Loss: {val_loss:.4f}')
ノイズデータと元データと再構成データの比較
# 再構成データの取得
autoencoder.eval()
with torch.no_grad():
    _, decoded_imgs = autoencoder(x_test_noisy)

# 元画像と再構成画像のプロット
n = 10  # 表示する画像の数
plt.figure(figsize=(20, 6))
for i in range(n):
    # ノイズ付き元画像
    ax = plt.subplot(3, n, i + 1)
    plt.imshow(x_test_noisy[i].reshape(28, 28).numpy(), cmap='gray')
    plt.title("Noisy")
    plt.axis('off')

    # クリーンな元画像
    ax = plt.subplot(3, n, i + n + 1)
    plt.imshow(x_test[i].reshape(28, 28).numpy(), cmap='gray')
    plt.title("Original")
    plt.axis('off')

    # 再構成画像
    ax = plt.subplot(3, n, i + 2 * n + 1)
    plt.imshow(decoded_imgs[i].reshape(28, 28).numpy(), cmap='gray')
    plt.title("Reconstructed")
    plt.axis('off')
plt.show()
オートエンコーダよりもデノイジングオートエンコーダの方がオリジナルに近い再構成していると言えそうです。
異常検知
ノイズを加えたテストデータを入力として、クリーンなデータをターゲットとして再構成誤差を計算します。
# 再構成誤差の計算
autoencoder.eval()
with torch.no_grad():
    _, decoded_imgs = autoencoder(x_test_noisy)

reconstruction_error = torch.mean((x_test - decoded_imgs) ** 2, dim=1).numpy()

# 閾値設定(例:95パーセンタイル)
threshold = np.percentile(reconstruction_error, 95)

# 異常データの検出
anomalies = reconstruction_error > threshold

# 結果の表示
print(f'Reconstruction error threshold: {threshold}')
print(f'Number of anomalies detected: {np.sum(anomalies)}')
Reconstruction error threshold: 0.04544343613088131
Number of anomalies detected: 500デノイジングオートエンコーダを使用してノイズ除去の誤差を計算する際には、ノイズを加えたデータを入力として、クリーンなデータをターゲットとして再構成誤差を計算します。ガウスノイズを加えたデータを使用してモデルを訓練し、再構成誤差を計算することで、異常データを検出することができます。
実装の改善ポイント
| カテゴリ | 改善ポイント | 詳細 |
|---|---|---|
| モデルの最適化 | ハイパーパラメータの調整 | トピック数、エポック数、潜在次元数などの最適な値を設定。ベイズ最適化やグリッドサーチを使用。 |
| ベイズ最適化・グリッドサーチ | モデルのパフォーマンスを最大化するために、最適なパラメータを効率的に見つける手法。 | |
| 計算効率の向上 | バッチ処理 | 大規模データセットに対して効率的に学習するためにバッチ処理を用いる。 |
| GPUの活用 | GPUを使用することでディープラーニングモデルの学習を高速化。 | |
| さらなる改良点の提示 | 他のモデルとの組み合わせ | LDAとワードベクトルの組み合わせ、オートエンコーダとクラスタリングを組み合わせることで性能を向上。 |
モデルの応用と発展の可能性
他のテーマモデリング手法の紹介
- 非負値行列因子分解(NMF):LDAの代替手法として、トピックモデリングに応用
高度なオートエンコーダの活用
- 変分オートエンコーダ(VAE):生成モデルとして新しいデータの生成に利用
- スパースオートエンコーダ:特徴選択や次元削減における解釈性の向上
学習の振り返りと次回予告
今回の第8回(後編)では、複雑なデータ構造を解析するための2つの重要な技術、LDAとオートエンコーダを学びました。
LDAでは、テキストデータに潜むトピック構造を発見するテーマモデリングの理論と実装を深掘りし、ビジネスやマーケティングなどでの応用可能性を確認しました。一方でオートエンコーダでは、ニューラルネットワークを使って高次元データを低次元の潜在空間に圧縮し、次元削減や異常検知、データノイズの除去などの応用について理解を深めました。これらの技術を学ぶことで、データの中に隠されたパターンや洞察を効率的に抽出する力を養うことができました。
特にLDAとオートエンコーダは、データが複雑化・高次元化する現代において不可欠な手法であり、それぞれが異なる課題に対して効果的であることを学びました。
次回の第9回では、深層学習(ディープラーニング)の基礎をより深く掘り下げ、ニューラルネットワークの仕組みと実装方法に焦点を当てていきます。ニューラルネットワークをPyTorchで実装し、異なるフレームワークの特性とその活用法を比較しながら理解を深めていく予定です。
次回の目標は、深層学習の基本構造を理解し、PyTorchを用いて簡単なモデルを構築・訓練するスキルを身に付けることです。また、深層学習の基礎を押さえ、実務や研究における選択肢を広げることにも繋げていきます。
次回も引き続き、実践的なスキルを磨いていきましょう!


コメント